Explanation
First Glances at the Data
This page explores the trends observed in our dietary data, focusing on shifts in American nutrition and health outcomes.
Why Did Ultra-Processed Food Consumption Decline After 2018?
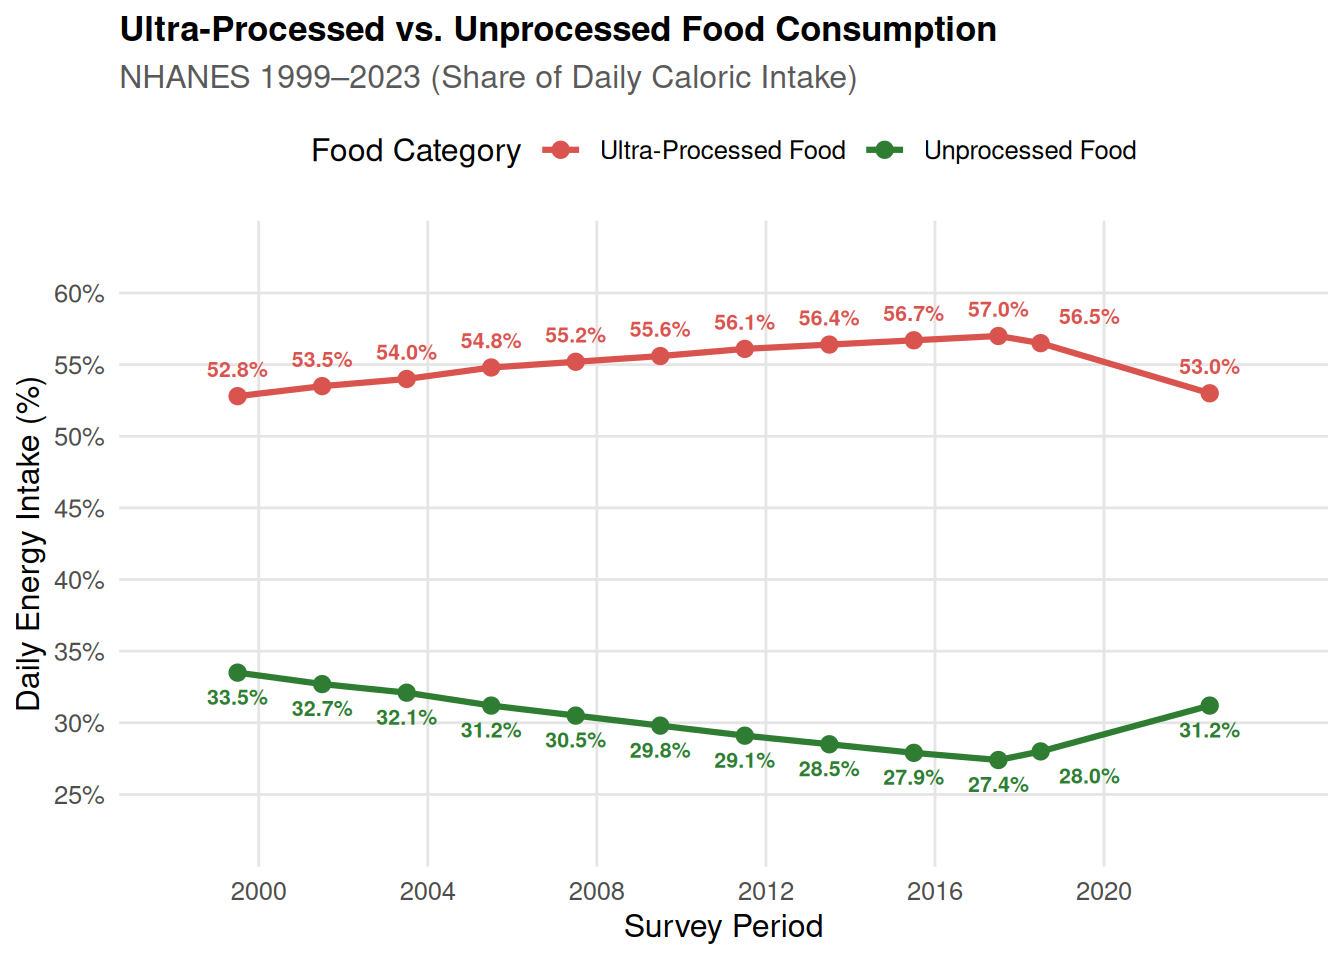
According to NHANES dietary recall surveys, daily caloric intake from ultra-processed foods (UPFs) climbed steadily for nearly two decades, peaking around 57.0% in 2017–2018 before falling to approximately 53.0% by 2021–2023.
Researchers and public health analysts attribute this recent decline to several intersecting factors:
1. Shift Toward Home Cooking During the COVID-19 Pandemic
During 2020 and 2021, pandemic-related lockdowns, remote work, and restaurant closures led millions of households to prepare meals at home. Cooking from scratch inherently relies more on unprocessed and minimally processed ingredients (such as produce, eggs, whole grains, and raw meats) compared to commercial convenience meals and fast food.
2. Growing Awareness of Ultra-Processed Foods
The term “ultra-processed food” (based on the NOVA food classification system) gained widespread public recognition following high-profile research—most notably the 2019 National Institutes of Health (NIH) randomized controlled trial by Dr. Kevin Hall and colleagues. This study provided direct clinical evidence that ultra-processed diets lead to excess calorie intake and weight gain, sparking extensive media coverage and consumer interest in whole foods.
3. Food Inflation and Economic Pressures
From 2021 to 2023, high inflation sharply increased the prices of packaged snack foods, ready-to-eat meals, and restaurant dining. Faced with tighter food budgets, many consumers substituted expensive pre-packaged items with less costly pantry staples (such as beans, rice, and fresh or frozen vegetables).
4. Updated Nutrition Labeling
The FDA’s updated Nutrition Facts label—which required companies to clearly disclose “Added Sugars”—took full effect for major food manufacturers around 2020–2021. This greater transparency made it easier for consumers to identify heavily processed foods and encouraged manufacturers to reformulate certain product lines.
Obesity Distribution by Age and Weight
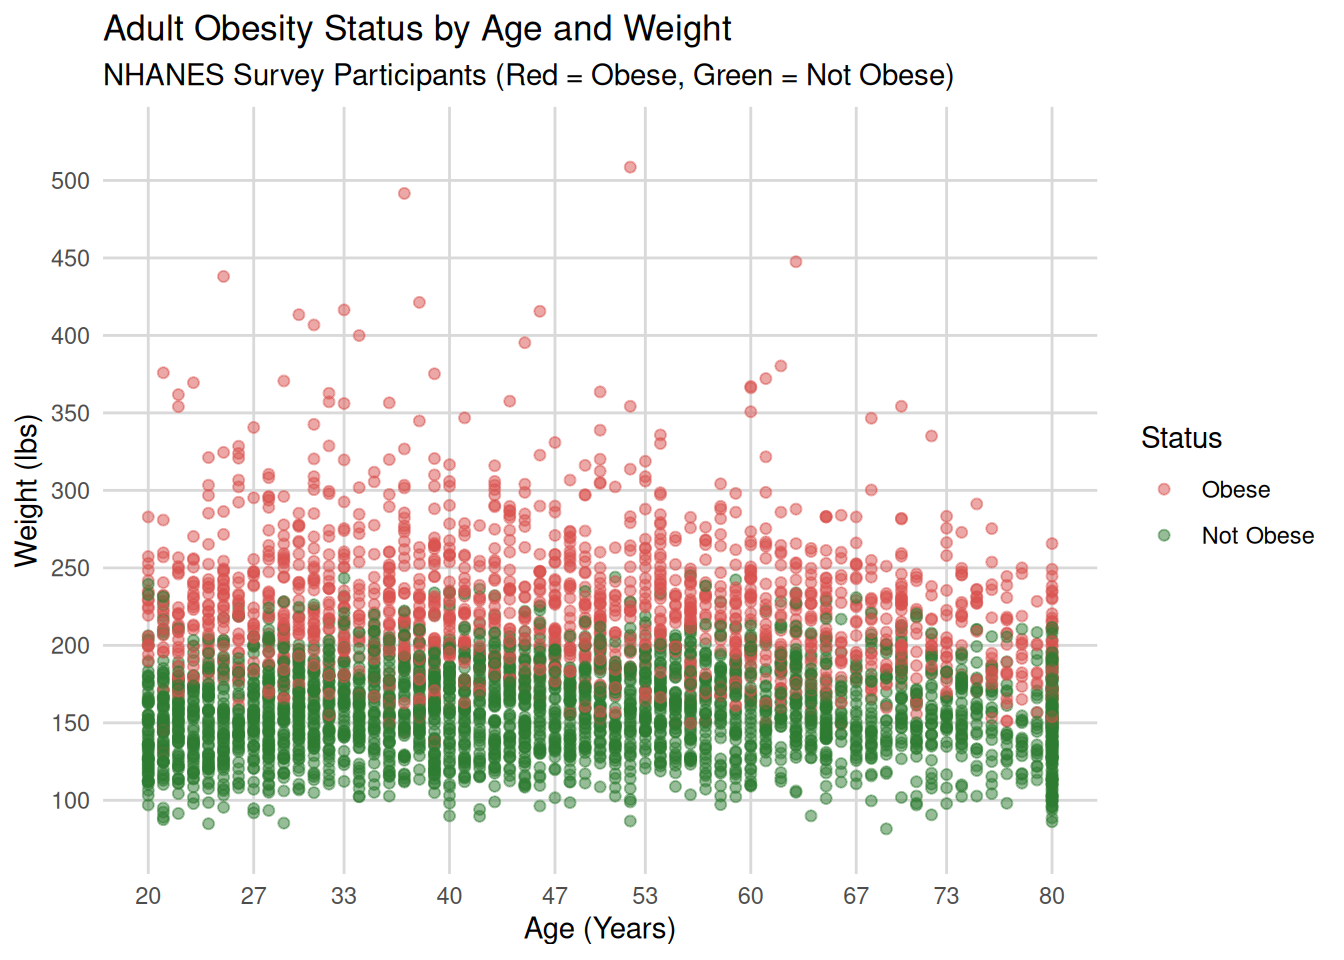
This graph maps thousands of adult survey participants from the NHANES dataset across age and weight. Points in red represent individuals recorded as obese (\(\text{BMI} \ge 30\)), while points in green represent individuals who are not obese.
Non-Dietary Factors Influencing Obesity Rates
While diet and caloric intake are major drivers, obesity is a multifactorial condition influenced by several physiological, behavioral, and environmental determinants:
1. Physical Inactivity and Sedentary Lifestyles
Modern occupations, screen time, and car-dependent transportation have substantially decreased baseline physical activity. Lower energy expenditure reduces metabolic rate and impairs glucose regulation, increasing the likelihood of excess weight gain over time.
2. Sleep Deficiency and Circadian Disruption
Chronic sleep deprivation alters key metabolic hormones—suppressing leptin (the satiety signal) while increasing ghrelin (the hunger stimulant). Poor sleep quality also impairs insulin sensitivity and raises daytime fatigue, discouraging physical activity.
3. Chronic Stress and Hormonal Imbalances
Prolonged psychological stress triggers sustained release of cortisol, a hormone that promotes abdominal fat accumulation and increases cravings for energy-dense foods. Endocrine disruptors and hormonal shifts can also influence fat storage.
4. Genetics and Epigenetic Factors
Genetic variation affects baseline metabolic rates, fat distribution, and neurochemical pathways governing appetite and satiety. Epigenetic mechanisms can also alter metabolic set points across generations.
5. Built Environment and Socioeconomic Status
Communities with limited walkable infrastructure, fewer safe recreational spaces, higher poverty rates, and unequal access to healthcare experience elevated obesity risks independent of individual dietary choices.